Unlock the difference between ROI vs ROAS. Learn the formulas, when to use each metric, and how to measure true marketing profitability for your business.
December 9, 2025 (1mo ago)
ROI vs ROAS A Marketer's Guide to True Profitability
Unlock the difference between ROI vs ROAS. Learn the formulas, when to use each metric, and how to measure true marketing profitability for your business.
← Back to blog
ROI vs ROAS: Guide to True Marketing Profitability
Summary: Unlock the difference between ROI vs ROAS. Learn the formulas, when to use each metric, and how to measure true marketing profitability for your business.
Introduction
ROAS and ROI look similar but answer very different business questions. ROAS measures the revenue returned for every dollar spent on ads, while ROI measures net profit after all costs are counted. Use ROAS to optimize campaigns and ROI to judge whether your marketing actually improves the bottom line.
The real difference: tactical versus strategic
ROAS looks at gross revenue from a specific ad campaign. ROI measures net profit from your entire investment after every cost is subtracted. ROAS is a focused tool for campaign optimization. ROI is the broad metric for strategic decisions and long-term planning.
Think of ROAS as the power drill and ROI as the blueprint. A great drill helps complete one task efficiently. The blueprint tells you whether the whole project makes sense.
The strategic view versus the tactical view
One metric gives a laser-focused view of ad performance. The other gives a high-level view of business profitability. Confusing the two can lead to costly mistakes for your marketing program.
Example: a radio ad in Chicago might show strong ticket sales for a concert (high ROAS), but the tour’s final P&L — including venue rental, crew, security, and insurance — determines whether the tour makes money (ROI).
Why this distinction matters
Chasing high ROAS without watching ROI is a classic trap. ROAS ignores many business costs, such as:
- Cost of Goods Sold (COGS)
- Operating expenses: salaries, software, rent
- Fulfillment costs: shipping and packaging
- Agency or partner fees
A campaign that returns $2.50 for every $1 in ad spend (2.5 ROAS) can still leave the company with low or negative profit once total costs are included. Benchmarks like a 4:1 ROAS are often cited as strong targets, but whether that’s profitable depends on your margins and fixed costs1.
Key differences: ROI vs ROAS
| Attribute | ROAS (Return on Ad Spend) | ROI (Return on Investment) |
|---|---|---|
| Primary focus | Gross revenue per dollar of ad spend | Net profit from the total investment |
| Scope | Campaign-level, narrow | Business-level, broad |
| Purpose | Tactical ad optimization | Strategic profitability and planning |
| Calculation | Revenue from ads / Cost of ads | (Net profit - Total investment) / Total investment x 100 |
| Use case | A/B tests, bids, creative, channel comparison | Budget allocation, project justification, long-term planning |
ROAS asks, “Is this ad working?” ROI asks, “Is this effort making us money?”
How to calculate ROI and ROAS — formulas and examples
Formulas:
- ROAS = Revenue from ad campaign / Cost of ad campaign
- ROI = (Net profit - Total investment) / Total investment
The difference is what you include in Cost versus Total Investment. ROAS focuses on direct ad spend. ROI forces you to account for product cost, shipping, salaries, software, and more.
E-commerce example: the high ROAS trap
Campaign data:
- Revenue from ads: $10,000
- Ad spend: $2,000
ROAS: $10,000 / $2,000 = 5 (500% ROAS)
Additional costs:
- COGS: $3,000
- Shipping & fulfillment: $1,000
- Payment fees: $290
- Total investment: $6,290
Net profit: $10,000 - $6,290 = $3,710
ROI: ($3,710 / $6,290) x 100 = 59% ROI
A 500% ROAS looks flashy, but the true profit picture is a 59% ROI once all costs are included.
B2B SaaS subscription example
Campaign data:
- Google Ads spend: $5,000
- New customers: 20
- Revenue (month 1): $2,000
ROAS (month 1): $2,000 / $5,000 = 0.4 (40% ROAS)
But factoring lifetime value over 12 months:
- Support & onboarding: $1,000
- Infrastructure: $400
- Total investment: $6,400
- Lifetime revenue: 20 x $100 x 12 = $24,000
Net profit: $24,000 - $6,400 = $17,600
ROI: ($17,600 / $6,400) x 100 = 275% ROI
Customer Lifetime Value (CLV) can flip a campaign from a short-term loss into a long-term winner2.
Affiliate marketing example
Campaign data:
- Revenue driven by affiliates: $50,000
- Commissions (20%): $10,000
ROAS: $50,000 / $10,000 = 5 (500% ROAS)
Additional costs:
- COGS: $20,000
- Platform fee: $500
- Manager salary portion: $1,500
- Total investment: $32,000
Net profit: $50,000 - $32,000 = $18,000
ROI: ($18,000 / $32,000) x 100 = 56.25% ROI
All three examples show the same lesson: ROAS alone can be misleading. ROI reveals whether the marketing actually contributes profit.
Choosing the right metric for the right decision
ROAS and ROI serve different purposes. Use ROAS for real-time, tactical optimization and ROI for strategic, long-term decisions.
When to use ROAS
ROAS is ideal when you need quick answers about ad performance:
- A/B testing creative
- Optimizing keyword bids in PPC
- Comparing channel efficiency between Google Ads and Facebook Ads
ROAS helps you decide which ads or channels deserve incremental budget immediately.
When to use ROI
ROI is what leadership and finance teams use to judge whether marketing investments are sustainable:
- Allocating annual budgets
- Assessing channel sustainability after all costs
- Justifying large investments like an SEO overhaul
A 4:1 ROAS may seem strong, but after accounting for product costs and salaries the ROI could be razor-thin, which is why context matters1.
Navigating measurement pitfalls
A high ROAS can hide deeper problems. Here are common traps and how to avoid them.
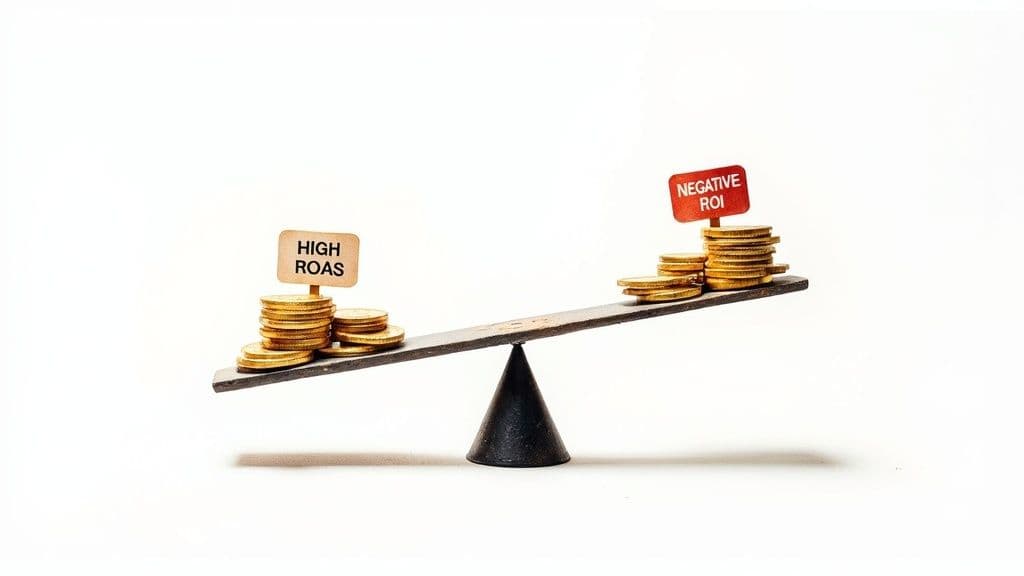
High ROAS, negative ROI paradox
A campaign can show strong revenue-per-ad-dollar but still lose money after COGS and other expenses. For example, high COGS can turn a 6:1 ROAS into a per-sale loss.
Attribution blind spots
Many platforms default to last-click attribution, which overcredits lower-funnel channels and undervalues top-of-funnel activity. Multi-touch attribution and proper tracking pixels help capture the full customer journey and give a fairer view of where value comes from3.
The long game: Customer Lifetime Value
Some channels show low initial ROAS yet deliver high CLV, making them far more valuable long term. Compare a one-time $100 buyer to a subscription customer who pays $20 per month for years — CLV changes the decision.
How to track true profitability in affiliate marketing
Affiliate programs must measure both ROAS and ROI to find partners who truly add profit, not just revenue. Use a dedicated affiliate platform to automate commission tracking, factor in platform fees and management time, and identify partners with high ROI rather than only high revenue.
Segment affiliates into tiers:
- High ROAS / High ROI — invest and scale
- High ROAS / Low ROI — reduce investment costs or change structure
- Low ROAS / Low ROI — retrain or remove
A platform that tracks the full cost picture helps you recruit and reward partners that improve margins.

Common questions about ROI and ROAS, answered
What is a good ROAS for my business?
There’s no universal benchmark. Good ROAS depends on margins and fixed costs. Calculate your break-even ROAS by including all non-ad expenses and use that as your minimum target1.
Can you have good ROI with poor ROAS?
Yes. Long-term investments like SEO or content may show weak or unmeasurable ROAS but deliver strong ROI over time when you count recurring revenue and reduced acquisition costs2.
How do I start tracking ROI instead of just ROAS?
Steps to shift focus:
- Gather every cost with finance: COGS, salaries, software, shipping
- Connect analytics, CRM, and financial systems for joined-up reporting
- Use multi-touch attribution to credit all contributing touchpoints3
Quick Q&A
Q: Should I optimize for ROAS or ROI first?
A: Use ROAS for day-to-day ad optimization and ROI for strategic budget decisions. Both matter, but prioritize ROI when assessing sustainability.
Q: How do I compare channels fairly?
A: Use ROAS to compare short-term efficiency and ROI to compare long-term profitability after including all costs and CLV.
Q: What’s the single biggest mistake marketers make here?
A: Treating ROAS as a profit metric. ROAS shows revenue efficiency; only ROI shows true profit.
Additional resources and links
- Google Ads: https://ads.google.com/
- Facebook Ads: https://www.facebook.com/business/ads
- Guide to tracking UTM parameters: https://sharemysaas.com/blog/google-analytics-utm-parameters
- Guide to affiliate links: https://sharemysaas.com/blog/how-to-create-affiliate-links
1.
WordStream, “What Is a Good ROAS? Benchmarks and Best Practices,” https://www.wordstream.com/blog/ws/2017/04/17/ppc-roas.
2.
Investopedia, “Customer Lifetime Value (CLV),” https://www.investopedia.com/terms/c/customer-lifetime-value.asp.
3.
HubSpot, “Attribution Models: How to Attribute Marketing Efforts,” https://blog.hubspot.com/marketing/attribution-models.
💸 Get 10x More People SharingWith Zero-Friction Signup
Traditional sharing programs lose most potential promoters at signup. ShareMySaaS eliminates that barrier completely — users start sharing with one click, no forms required. Turn every satisfied customer into an active promoter and watch your reach explode.