Master the ad performance metrics that drive SaaS success. This guide breaks down CTR, CPA, LTV, and ROAS to help you optimize campaigns and maximize profit.
January 30, 2026 (2d ago)
Unlocking SaaS Growth with Ad Performance Metrics
Master the ad performance metrics that drive SaaS success. This guide breaks down CTR, CPA, LTV, and ROAS to help you optimize campaigns and maximize profit.
← Back to blog
Unlocking SaaS Growth with Ad Performance Metrics
Summary: Master the ad performance metrics that drive SaaS success. This guide breaks down CTR, CPA, LTV, and ROAS to help you optimize campaigns and maximize profit.
Introduction
Ad performance metrics are the signals that tell you whether your ad budget is building growth or burning cash. For SaaS teams, the difference between scaling profitably and wasting spend comes down to understanding CTR, CPA, LTV, ROAS, and how they work together. This guide gives you clear definitions, practical formulas, and an action framework to turn raw ad data into measurable growth.
Why Ad Metrics Are Your SaaS Growth Compass

For a SaaS company, growth isn’t just about spending more. It’s about spending smarter. Ad performance metrics are the dashboard for your marketing—showing speed, efficiency, and direction so you can make strategic decisions instead of guessing.
These numbers give you accountability and a repeatable system for acquiring customers. Once you read them correctly, you can justify spend, prove value, and optimize campaigns to scale profitably.
From Guesswork to Strategy
Relying on gut feeling is a quick path to wasted budgets. A data-first approach helps you identify which campaigns to scale, which to pause, and which to tweak. This mindset is the foundation for everything from running Google Ads campaigns to launching an affiliate program.
Mastering these metrics gives you three advantages:
- Improved decision-making: pick the right campaigns to expand or cut.
- Enhanced accountability: link ad spend directly to customers and revenue.
- Greater efficiency: invest in channels that deliver the best returns.
By translating clicks and impressions into business outcomes, you turn raw data into your most powerful growth tool.
A Foundation for Smart Scaling
Ad metrics let founders and marketers build a repeatable, profitable customer acquisition system. Whether you’re testing a new channel or managing a large budget, these numbers tell the story of your customers’ journey and how your ads fit into it.
Mastering the Foundational Ad Performance Metrics
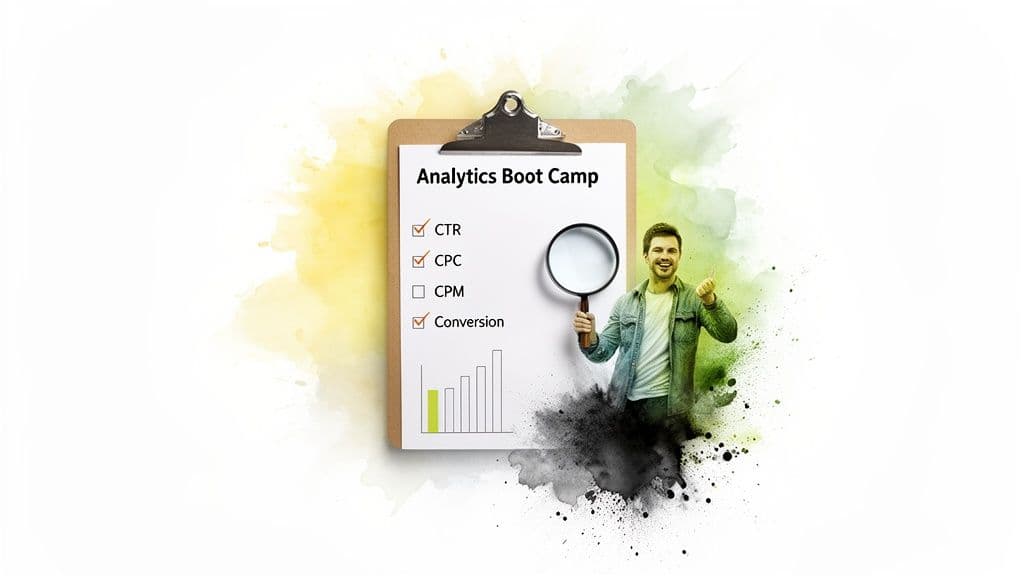
Start with the essentials. These first-line diagnostics give a quick pulse on your campaign health and show how effectively you’re capturing attention.
Click-Through Rate (CTR): Your Ad’s First Impression
Click-Through Rate (CTR) measures the percentage of people who clicked your ad after seeing it. It’s a direct signal of ad relevance—creative, copy, and targeting.
CTR = (Total Clicks / Total Impressions) × 100
If an ad was shown 10,000 times and got 250 clicks, CTR = 2.5%. High CTR often leads platforms to reward your ad with better visibility and lower costs.1
Cost Metrics: Understanding What You Pay for Attention
CTR shows interest. Cost metrics show efficiency. Two key measures are:
- Cost Per Click (CPC): what you pay each time someone clicks your ad.
- Cost Per Mille (CPM): what you pay per 1,000 impressions, useful for brand awareness.
A high CPC can be acceptable if those clicks turn into valuable customers. Monitor these alongside conversion metrics to avoid bleeding budget. For a deeper look at how costs tie to acquisition, see our CPA guide.2
Conversion Rate: The Ultimate Test of Persuasion
Conversion Rate = (Total Conversions / Total Clicks) × 100
Clicks bring people in, conversions turn them into leads or users. If you have a high CTR but a low conversion rate, your landing page or offer probably doesn’t match the ad’s promise.
Essential Ad Metrics at a Glance
| Metric | What It Measures | Why It Matters for SaaS |
|---|---|---|
| Click-Through Rate (CTR) | Percentage of impressions that become clicks | Shows ad relevance; high CTR can lower costs |
| Cost Per Click (CPC) | Average cost per click | Tracks cost efficiency for driving traffic |
| Cost Per Mille (CPM) | Cost per 1,000 impressions | Measures cost of visibility for awareness campaigns |
| Conversion Rate | Percentage of clicks that convert | Shows how well you turn traffic into leads or sign-ups |
Looking at these together gives a full picture: CTR shows interest, CPC/CPM show cost, and conversion rate shows true effectiveness.
Connecting Ad Spend to Real Business Impact
Clicks and impressions won’t tell you if your ads are profitable. To answer “Was this investment profitable?” you need deeper business metrics.
Cost Per Acquisition (CPA): The True Price of a New Customer
CPA = Total Ad Spend / Number of New Customers Acquired
If you spent $2,000 and gained 40 paying customers, CPA = $50. That number only becomes meaningful when compared to what those customers will pay over time.
Return On Ad Spend (ROAS): Measuring Direct Profitability
ROAS = Total Revenue from Ads / Total Ad Spend
If 40 customers each pay $30 in their first month, revenue = $1,200, so ROAS = $1,200 / $2,000 = 0.6×. That’s not profitable in month one, but it doesn’t reflect future value. For how ROAS differs from ROI, see the guide on ROAS vs ROI.3
A common industry figure shows smart ad spending can return an average of about $4.20 for every dollar spent in some social channels, but results vary widely by industry and strategy.4
Lifetime Value (LTV): The North Star for Sustainable Growth
LTV = Average Revenue Per Account (ARPA) / Customer Churn Rate
If ARPA = $30/month and monthly churn = 5%, LTV = $30 / 0.05 = $600. Suddenly a $50 CPA looks excellent. LTV gives necessary context to CPA and ROAS: a high CPA can be worth it if LTV is much higher.
These metrics work together:
- CPA tells you what you paid to acquire a customer.
- ROAS shows immediate revenue returned.
- LTV shows the long-term value of that customer.
Aligning Metrics with Your Campaign Goals
Not every metric fits every goal. Match KPIs to campaign objectives so you don’t optimize for the wrong things.
Goals for Brand Awareness
Top-of-funnel campaigns aim to increase visibility. Primary metrics:
- Impressions
- Reach
- CPM
These metrics help you plant seeds rather than force conversions.
Goals for Lead Generation and Consideration
Consideration campaigns move people from awareness to interest. Key metrics:
- CTR
- CPA (cost per lead)
- Conversion Rate
A low conversion rate on an awareness campaign isn’t a failure if the campaign wasn’t designed to convert.
Goals for Direct Conversions and Sales
Bottom-of-funnel campaigns must tie directly to revenue. Primary metrics:
- ROAS
- LTV
- Final CPA (cost per paying customer)
| Campaign Objective | Primary Metrics | Secondary Metrics |
|---|---|---|
| Brand Awareness | Impressions, Reach, CPM | View-through conversions, video views |
| Lead Generation | CPA (Cost Per Lead), Conversion Rate | CTR, CPC |
| Direct Sales | ROAS, CPA (Cost Per Sale), LTV | Conversion Rate, AOV |
| Engagement | Engagement Rate, Likes, Shares | CTR, CPC |
Choose KPIs that reflect the campaign’s true purpose to avoid chasing vanity metrics.
Building a Trustworthy Measurement System
Accurate data is non-negotiable. Messy tracking produces bad decisions, and your ad spend becomes a money pit. Start with solid tracking and a clear attribution approach.
Accurate Data Collection
Two common approaches:
- Tracking pixels (client-side): easy to implement but vulnerable to ad blockers and privacy changes.
- Server-side tracking: more resilient and reliable, since data is sent from your server to the ad platform.
Implementing both client- and server-side tracking gives a more complete picture. For setting up Google Ads conversion tracking, refer to conversion tracking best practices.6
Understanding Attribution Models
An attribution model decides which touchpoint gets credit for a conversion. Choosing a model is strategic—it shapes budget allocation and channel focus.
Common models:
- First-click: credits the first interaction.
- Last-click: credits the final interaction.
- Linear: splits credit evenly across touchpoints.
- Data-driven: uses machine learning to assign credit based on observed impact.
Pick the model that aligns with how you believe marketing drives conversions, and be consistent so you can compare performance over time. Learn more about attribution models in our guide.5
Common Measurement Pitfalls to Avoid
- Ignoring conversion lag. SaaS customers often convert weeks after initial contact. Let data mature before judging performance.
- Misinterpreting statistical significance. Don’t make big decisions from small samples.
- Forgetting view-through conversions. Not every conversion starts with a click; views can influence later conversions.
Global ad spending and platform performance change fast, so measurement rigor is essential for accurate decisions.4
Turning Ad Data into Actionable Insights
Collecting metrics is only half the job. The other half is using them to improve performance. Pull platform data into a unified dashboard, visualize trends, and run controlled experiments to learn quickly.
Designing Your Performance Dashboard
A useful dashboard is focused and actionable. Include:
- North-star KPIs (ROAS, CPA, LTV)
- Campaign-level breakdowns
- Pacing charts for spend vs budget
- Funnel visualizations from impressions to conversions
Show metric relationships so you can see how a change to CTR affects CPC and CPA downstream.
A Framework for Continuous Optimization
Use a four-step cycle: Analyze, Hypothesize, Test, Repeat.
- Analyze: find the weakest link in your funnel.
- Hypothesize: create a clear, testable idea (for example, “Matching headline to ad copy will increase conversion rate by 15%.”).
- Test: run an A/B test and gather statistically significant results.
- Repeat and scale: roll out winners, learn from losers, and keep iterating.
This methodical approach turns insights into measurable improvements, so every marketing dollar performs better over time.
Frequently Asked Questions
What is a realistic ROAS target for SaaS?
There’s no universal number. Early-stage startups may accept a 3:1 ROAS to grow market share, while mature companies often need a higher ratio to remain profitable. Always compare ROAS to LTV to determine sustainability.3
How often should I check ad performance metrics?
Use a cadence that balances vigilance and perspective:
- Daily glance for new or high-spend campaigns to spot red flags.
- Weekly reviews for optimization and tactical changes.
- Monthly analysis for strategic decisions and budget shifts.
Which matters more: CTR or conversion rate?
Both matter. CTR shows whether your ad gets attention; conversion rate shows whether your landing page converts that attention into action. Conversion rate is closer to revenue, but you need CTR to generate traffic in the first place.
Ready to turn customers into promoters? ShareMySaaS helps you launch and automate an affiliate program in minutes, turning every happy user into a potential promoter. Discover how ShareMySaaS can scale your growth.
1.
Google Ads official site. https://ads.google.com
2.
What is Cost Per Acquisition? ShareMySaaS blog. https://sharemysaas.com/blog/what-is-cost-per-acquisition
3.
ROI vs ROAS guide. ShareMySaaS blog. https://sharemysaas.com/blog/roi-vs-roas
4.
Social Pulse Stats: Social media advertising statistics and platform performance analysis. https://socialpulsestats.com/social-media-advertising-statistics-2025-platform-performance-data-roi-analysis/
5.
What is an attribution model? ShareMySaaS blog. https://sharemysaas.com/blog/what-is-an-attribution-model
6.
Google Ads conversion tracking best practices. https://www.keywordme.io/blog/google-ads-conversion-tracking
💸 Get 10x More People SharingWith Zero-Friction Signup
Traditional sharing programs lose most potential promoters at signup. ShareMySaaS eliminates that barrier completely — users start sharing with one click, no forms required. Turn every satisfied customer into an active promoter and watch your reach explode.